“The past, present and future are only illusions, even if stubborn ones.”
— Albert Einstein —
6
Modeling
Galaxy Interactions
Why are not all galaxies the same? Why do galaxies show such a variety of properties? Why do galaxies come in such a wide variety of shapes and sizes? How do they evolve? Were galaxies predestinated at the moment of their birth? In this chapter, we will show how to study galaxy collisions and mergers with computer simulations.
“Spiral nebulae” were once thought to be inside the main and single galactic continent, our Milky Way galaxy. When these “nebulae“ were recognized as galaxies in their own right by Hubble[51] (1925) with vast distances between them, galaxies were then thought of as “island universes” slowly evolving in isolation. These early studies of galaxy dynamics were based on an extraordinary success of isolated system. The problem is that no real system is truly isolated. Galaxies have peculiar velocities in space relative to the general expansion of the universe (Hubble flow) and they can get close to each other.
In 1956, Fritz Zwicky as the first one spotted an enormous variety of extended features seen in interacting galaxies[52]. As galaxy catalogs began to grow (Arp, 1966), the number of anomalously looking peculiar galaxies was mounting. Distorted galaxies with arcs, tails, ripples, plumes, wings, shells, bridges, tails, and grand arms emanating from their bodies were discovered. These galaxies have blue colors suggesting that new stars are born within these galaxies (high star formation rate, SFR).
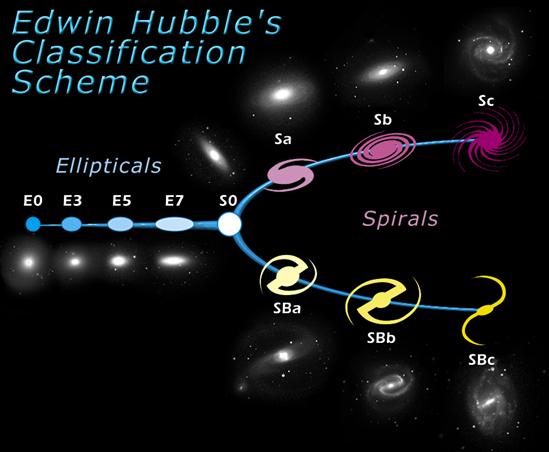
Figure 6–1: Galactic species in the Hubble’s galactic family. The “tuning fork” classification scheme (Hubble, 1926) of elliptical (Ex), lenticular (S0), spiral (Sx), and barred spiral (SBx) galaxies. Courtesy Space Telescope Science Institute (STScI).
6.1.1 The structure of the universe
The currently most successful model of the universe is the Big Bang theory with inflationary LCDM[53] model that explains observed properties of our universe on super-galaxy scales. According to this standard cosmological model, our universe started with a very hot and very uniform matter distribution. However, primordial small-scale quantum fluctuations[54] in the matter distribution (small inhomogenities) (Peebles, 1974) were inflated to huge dimensions after the Big Bang. Successive accumulation of matter was started in places with the higher concentration of matter, given by primordial fluctuations (inhomogenities) through the gravitational attraction. Weak density inhomogenities of baryonic matter[55] were amplified by the gravitation of dark matter and caused the growth of inflated fluctuations. A cooling gas was attracted by the clumps of dark matter forming visible parts of galaxies. Small systems composed of the dark matter and gas have continued to merge and formed larger objects. This process led to the formation of all structures – galaxies, groups, clusters, super-clusters of galaxies and to the overall large-scale structure of the universe (LSS) (White and Rees, 1978) – and continues up to this today. This structure formation scenario is known as the hierarchical merging scenario.
Gravitation reorganized initial fluctuations in the matter distribution into the structure, where stars are clustered in galaxies, galaxies are clustered into galaxy groups, galaxy groups form galaxy clusters, and galaxy clusters form super-clusters of galaxies. Some clusters are not comprised of small groups, but are simply large, galaxy filled clusters. They are called “rich clusters” (e.g. Coma cluster).
The fluctuations in the matter distribution (seeds of galaxies) grew during initial inflation phase in the early universe linearly and are therefore suitable for analytical studies. However, when the fluctuations began to grow in amplitude through gravitation and started to form galaxies and clusters of galaxies in non-linear process, the only way to study them are numerical simulations on computer.
6.1.2 Demography of galaxy clusters
Galaxy clusters are ensembles of a few tens to a few thousands of galaxies bound together by the gravity. Rich clusters with a high galaxy density contain a large number of elliptical[56] galaxies. A supergiant elliptical galaxy can be found at the very center of the rich cluster. Spiral galaxies are rare in rich clusters, but dominate in the space between clusters or in smaller groups with a low galaxy density[57]. This correlation between the galaxy type and the local galaxy density is called a Morphology-Density (MD) relation.
Deep field images
The farther away a galaxy is, the longer takes
to its light to get to us. Deep observations not only look to great distances,
but also look back in time. The universe is expanding according to the Big Bang
theory, and the more distant an object is, the more rapidly it is receding from
us. A velocity at which the object is moving away from us can be determined
from the incoming “light” by the shift in its spectral lines. By studying
galaxies at ever higher redshifts ![]() [58] (larger
distances), we can observe the universe at an ever younger age. Over the cosmic
time, we can see that galaxies are changing.
[58] (larger
distances), we can observe the universe at an ever younger age. Over the cosmic
time, we can see that galaxies are changing.
From the Hubble Deep Field (HDF) observations[59], we
know that galaxy sizes are growing with the time and simulataneously the number
of galaxies is dropping. Larger galaxies are built of the smaller ones through the
gravitational assembly and thus supporting the hierarchical merging scenario. Up
to 25 % of interacting and disturbed spiral galaxies can be seen on redshifts ![]() (now, on a redshift
(now, on a redshift ![]() , it is just 1 %). Spiral
galaxies on large distances are smaller, many are disturbed, assymetrical and
with high SFR. A lot of irregular and small fragments that appear to be
undergoing gravitational interactions and mergers are observed (Dressler et
al., 1994). MD relation therefore varies with the redshift. Giant ellipticals
exist at redshifts
, it is just 1 %). Spiral
galaxies on large distances are smaller, many are disturbed, assymetrical and
with high SFR. A lot of irregular and small fragments that appear to be
undergoing gravitational interactions and mergers are observed (Dressler et
al., 1994). MD relation therefore varies with the redshift. Giant ellipticals
exist at redshifts ![]() with about 50 %
of their current stellar mass, while cD galaxies underwent significant merging
events at redshifts
with about 50 %
of their current stellar mass, while cD galaxies underwent significant merging
events at redshifts ![]() .
.
An observational evidence for the hierarchical
merging scenario can be seen in rich clusters of galaxies, like the MS1054-03,
which is located at a redshift ![]() (8.8
billion light years away with currently favored cosmological parameters). From the
sample of 81 studied galaxies, 13 of them are in collision or are their recent
remnants (van Dokkum et al., 1999). Spiral galaxies were once located in
regions with small distances between galaxies. Nowadays, giant elliptical
galaxies are on their place.
(8.8
billion light years away with currently favored cosmological parameters). From the
sample of 81 studied galaxies, 13 of them are in collision or are their recent
remnants (van Dokkum et al., 1999). Spiral galaxies were once located in
regions with small distances between galaxies. Nowadays, giant elliptical
galaxies are on their place.
Galaxies are recognized as the product of evolution lasting nearly 14 billion years. It is clear that many galaxies interact with neighboring ones and galaxy interactions are believed to be the key evolutionary mechanism. Galaxy collisions are usual and gravitational interactions are responsible for many features seen in galaxies. Galaxies are metamorphosed by their mutual interactions. Galaxies are not longer seen as isolated and unchanging objects. Only a few galaxies did not experience interactions and mergers. Galaxies evolve, interact, merge and collide. The variation of structural properties of galaxies through the Hubble’s sequence is caused mainly by the gravitational interaction of galaxies. These interactions explain the Hubble’s galaxy classification and explain peculiar galaxies. Even our own galaxy is now undergoing morphological events through the strong interaction with surrounding dwarf galaxies.
Erik Holmberg (1941)
performed the first simulation of the N-body system representing interaction
of two stellar systems. It was an analog method for N-body simulation.
Holmberg replaced the gravity by the light (same ![]() law)
and stars represented by N light bulbs. The light bulbs were replaced
one at a time by a device connected to N photodetectors that measured
luminous flux at a distance
law)
and stars represented by N light bulbs. The light bulbs were replaced
one at a time by a device connected to N photodetectors that measured
luminous flux at a distance ![]() from remaining
light bulbs. The experimental system was a collection of 74 bulbs (
from remaining
light bulbs. The experimental system was a collection of 74 bulbs (![]() ) set up on a board.
Holmberg’s algorithm had an excellent
) set up on a board.
Holmberg’s algorithm had an excellent ![]() linear
complexity.
linear
complexity.
In 1960s, theoretical astronomers began to use digital computer simulations to study the effects of close encounters of galaxies and found that the peculiar properties could be explained through the gravitational interaction of galaxies. Computational astronomy began to emerge in order to understand to such peculiar galaxy behavior. Pioneering numerical simulations of colliding galaxies were performed by Alar and Juri Toomre (1972). They argued that galactic bridges and tails seen in some multiple galaxies were gravitationally induced during a close encounter of these galaxies. Increasing computational power led to more detailed simulations with more bodies representing each galaxy.
6.3 Configuration of galaxy interactions
Our universe is ancient and vast. It is not a static place, rather it evolves. Every possible configuration of initial conditions of galaxy interaction allowed by nature might occur or will occur. As the result, we can observe many structures and irregular galaxies.
In a two galaxy encounter, one galaxy will be
called a central galaxy and second, usually less massive, a companion
galaxy or a satellite galaxy. Disk orientations for galaxies are
described by the orientations of their angular momentum vectors. As explained
in Chapter 5.9, galaxy disks
created by our initial conditions generator lie in the xy plane.
Galaxies can be optionally reoriented before they are set on a collision
course. Galaxies can be rotated according to rotation angles ![]() ,
, ![]() and
and
![]() as shown on Figure 6–2 and
then set on the close encounter trajectory.
as shown on Figure 6–2 and
then set on the close encounter trajectory.
To classify galaxy interactions, we must parameterize the orbits of involved galaxies. Let us use two different models for interactions: a direct collision and Keplerian encounter. An unlimited number of initial configurations can be obtained by changing parameters of these interactions. To reliably follow a galaxy interaction of originally isolated galaxies, an initial separation should be substantially larger than galaxy sizes. Galaxies should be separated by ~ 10–100 times their sizes. However, many real satellite galaxies are very close to their centrals, so we must sometimes break this rule.
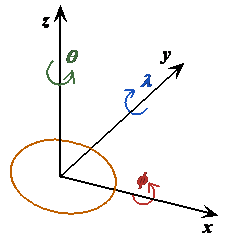
Figure 6–2: A disk situated in the xy plane can be rotated around all three axes.
All rotations are given by the right hand rule: ![]() (measured
in the yz plane around x),
(measured
in the yz plane around x), ![]() (measured
in the xz plane around y), and
(measured
in the xz plane around y), and ![]() (measured
in the xy plane around z).
(measured
in the xy plane around z).
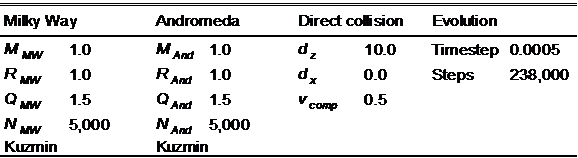
6.3.1 Direct collision
The central galaxy’s center-of-mass (CM) is
located at ![]() position. Initial conditions
of the companion galaxy’s CM are defined by the following set of parameters (Figure
6–3):
position. Initial conditions
of the companion galaxy’s CM are defined by the following set of parameters (Figure
6–3):
·
An initial separation ![]() between galaxies describes a
shift between the central and companion galaxy in the z-axis direction.
between galaxies describes a
shift between the central and companion galaxy in the z-axis direction.
·
An initial deviation ![]() of
the companion galaxy from the central galaxy defines the distance of the companion
galaxy’s CM from the central galaxy’s CM in the x-axis direction.
of
the companion galaxy from the central galaxy defines the distance of the companion
galaxy’s CM from the central galaxy’s CM in the x-axis direction.
·
An initial velocity of the companion galaxy ![]() describes the velocity of the
companion galaxy’s CM in respect to the central galaxy’s CM against the x-axis
direction.
describes the velocity of the
companion galaxy’s CM in respect to the central galaxy’s CM against the x-axis
direction.
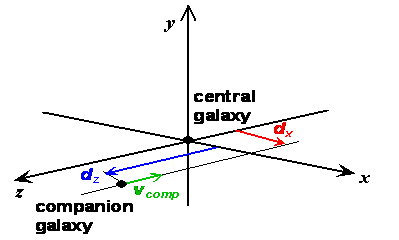
Figure 6–3: Parameters of the direct collision.
6.3.2 Keplerian encounter
Galaxies (centers-of-mass) are positioned on a two-body orbit that point particles of the same mass would follow. Keplerian encounter is described by the following orbital elements:
·
A numerical eccentricity ![]() is an eccentricity of a conic
section that is followed by the satellite galaxy. A circle has an eccentricity
of zero; for an ellipse it is less than one; for a parabola it is equal to one;
and for a hyperbola it is greater than one.
is an eccentricity of a conic
section that is followed by the satellite galaxy. A circle has an eccentricity
of zero; for an ellipse it is less than one; for a parabola it is equal to one;
and for a hyperbola it is greater than one.
· A semi-major axis a (see Figure 6–4).
· A true anomaly v is an angle between the position of the satellite galaxy and its pericenter as seen from the central galaxy’s CM situated in focus F.
A quantity relating the numerical
eccentricity ![]() and the semi-major axis a
is a linear eccentricity
and the semi-major axis a
is a linear eccentricity ![]() .
.
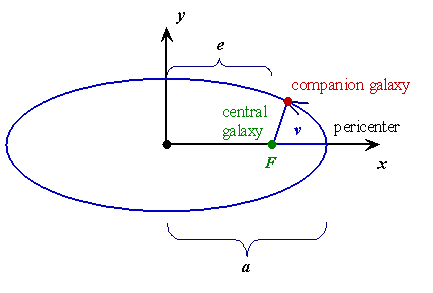
Figure 6–4: A schematic representation of initial conditions of two colliding galaxies in Keplerian elliptical encounter. The binary orbit lies in the xy plane. The central galaxy is located in focus F and the companion galaxy is located at the position given by the true anomaly v.
If the relative speed of galaxies in the interacting system is high enough, they will only briefly meet and then will escape. An internal structure and orbits of galaxies will be only slightly affected. Otherwise, the system will merge.
6.4.1 Mergers of spherical galaxies
The simplest simulations of galaxy interaction involve spherical galaxies (González-García and Albada, 2005). As a trial simulation of galaxy interaction, we can set up two identical spherical galaxies on the direct collision course. Galaxies forming the interacting pair are created separately as described in Chapter 5. Spheroid is run in isolation for 1 Gyr (see Table 6‑1) before being set into orbit.
Table 6‑1: Parameters of spheroidal galaxy and its isolated evolution.
Initial conditions of interaction are evolved with
the Barnes-Hut N-body simulation code with the opening angle ![]() . Gravitational forces were
calculated after smoothing the mass distribution using the softening length
. Gravitational forces were
calculated after smoothing the mass distribution using the softening length ![]() . The model is comparable to the
interaction of a real-world dwarf spherical galaxy with the following radius,
mass and Newton’s gravitation constant
. The model is comparable to the
interaction of a real-world dwarf spherical galaxy with the following radius,
mass and Newton’s gravitation constant
|
|
|

The time unit is comparable to ![]() , the timestep to
, the timestep to ![]() and the overall simulation
of interaction covers
and the overall simulation
of interaction covers ![]() .
.
Table 6‑2: Initial conditions for the direct interaction of spherical galaxies.
|
|
|
|
|
Start |
780 million years |
1.5 billion years |
|
|
|
|
|
|
|
|
|
2.4 billion years |
3.1 billion years |
3.9 billion years |
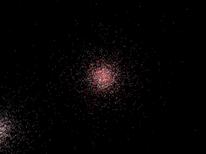
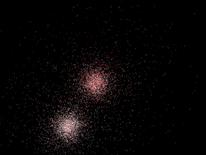
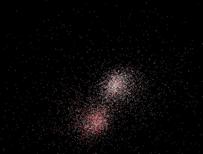
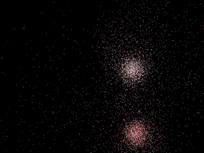
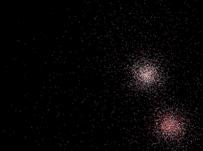
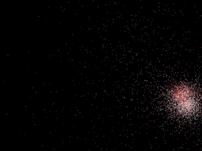
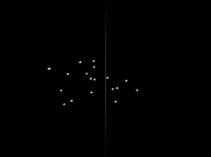
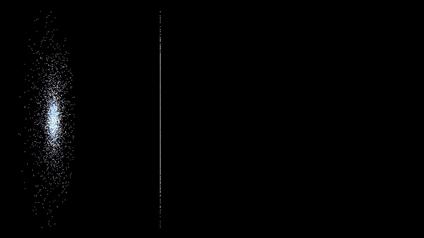
Figure 6–5: A time sequence of the “D run” of the direct collision of Plummer’s models in the xz plane evolved with the Barnes-Hut N-body algorithm.
|
|
|
|
|
Start |
780 million years |
1.5 billion years |
|
|
|
|
|
|
|
|
|
2.4 billion years |
3.1 billion years |
3.9 billion years |
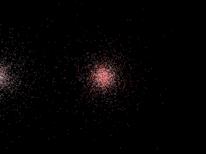
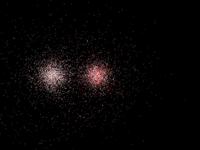
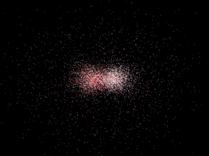
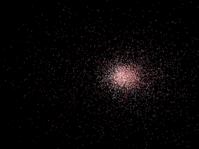
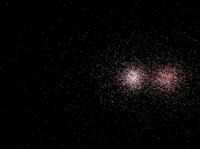
Figure 6–6: A time sequence of the “D run” of the direct collision of Plummer’s models in the yz plane evolved with the Barnes-Hut N-body algorithm.
Elliptical galaxies do not have an ordered motion of stars as spirals have. In spherical galaxies, which have a high anisotropy distribution in star velocities, it is harder to find spectacular tidal features. Merger remnants resulting from encounters of spheroids are again spherical galaxies.
6.4.2 Mergers of disk galaxies with satellites
Stars in spiral galaxies have ordered motion and so it is easier to find disturbances in such ordered motion caused by a tidal influence of the companion galaxy passing nearby.
An interaction of a large central galaxy interacting with a companion small satellite galaxy is called a minor merger (mass ratio of involved galaxies is smaller than 1/5). Here, the gravitational field of the more massive galaxy captures the smaller galaxy and gradually strips a material from this orbiting companion. As the satellite is stripped on its orbit, the stripped material is incorporated into the larger galaxy and loses its original identity as the satellite. The small galaxy is destroyed, while the massive galaxy retains its properties. This interaction is known under much more famous name cannibalism. Galactic cannibalism may strongly upset a disk structure of the central galaxy leading to the heatening of its stellar disk.
Dynamical friction
If a more massive body ![]() is getting through a uniformly
distributed sea of less massive
is getting through a uniformly
distributed sea of less massive
bodies ![]() , then bodies
, then bodies ![]() are dislocated into a
trailing wake behind the body
are dislocated into a
trailing wake behind the body ![]() In the
wake is therefore an increased density of bodies
In the
wake is therefore an increased density of bodies ![]() with
respect to places outside the wake. Bodies
with
respect to places outside the wake. Bodies ![]() are
accelerated and are gaining kinetic energy and momentum. Because of energy and
momentum conservation laws in a system consisting of body
are
accelerated and are gaining kinetic energy and momentum. Because of energy and
momentum conservation laws in a system consisting of body ![]() and bodies
and bodies ![]() the body
the body ![]() is losing in energy and
momentum, and suffers a steady deceleration. The body
is losing in energy and
momentum, and suffers a steady deceleration. The body ![]() is decelerated by this mechanism
in the direction of its motion by the dynamical friction (Chandrasekhar, 1943).
is decelerated by this mechanism
in the direction of its motion by the dynamical friction (Chandrasekhar, 1943).
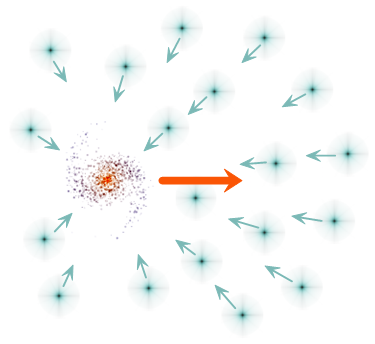
Figure 6–7: Smoothly distributed light particles (dark matter particles) attracted by the massive body (galaxy).
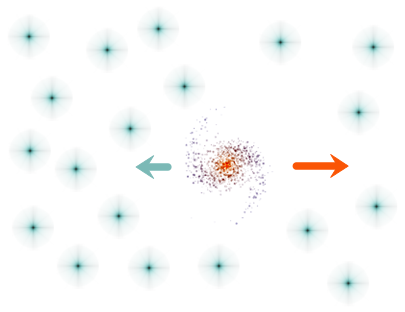
Figure 6–8: Light particles are dragged behind a massive body to form a „wake“. The massive body is decelerated.
A typical example of this mechanism is a dwarf galaxy flying through a dark matter halo (DMH) of a larger galaxy. The strong dynamical friction force slows down the moving dwarf galaxy that eventually merges with the large galaxy. The orbital velocity of the dwarf galaxy is reduced, causing it to spiral into the host galaxy (orbital decay). The extensive DMH and the dynamical friction force result in a more frequent merging between galaxies. DMH may extend many hundreds of kiloparsecs and can gravitationally interact and enhance the galaxy merger before and after the strong interaction of luminous parts of galaxies occur. Even when visible components of galaxies completely miss each other, their dark haloes may interact and lead the system to the merger.
Generic Models
A generic model A consists of the central Kuzmin’s
disk and the satellite Plummer’s sphere that is set into orbit immediately
without isolated evolution. Initial conditions of interaction are evolved with the
Barnes-Hut N‑body simulation code with the opening angle ![]() . The collision is strongly
off-center (
. The collision is strongly
off-center (![]() ).
).
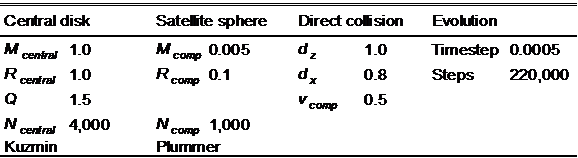
Table 6‑3: Parameters of the generic model A.
With the scaling
|
|
|

is the timestep equal to ![]() and the overall simulation
covers
and the overall simulation
covers ![]() .
.
The simulation of generic model A did not lead to the merger of the disk and the sphere in the simulated time.
A generic model B consists again of the central Kuzmin’s disk and the satellite
Plummer’s sphere that is set into orbit immediately. Initial conditions of
interaction are again evolved with the Barnes-Hut N-body simulation code
with the opening angle ![]() . The collision is
nearly perfectly polar (
. The collision is
nearly perfectly polar (![]() ).
).
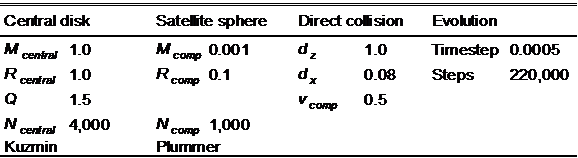
Table 6‑4: Parameters of the generic model B.
|
|
|
|
|
Start |
1.25 billion years |
2.5 billion years |
|
|
|
|
|
|
|
|
|
3.75 billion years |
5.0 billion years |
7.5 billion years |
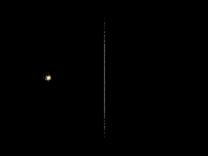
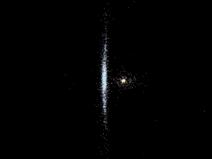
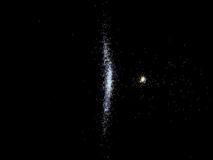
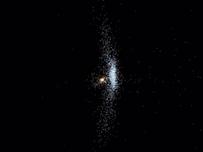
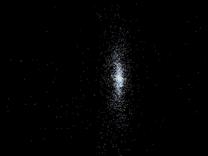
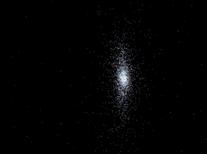
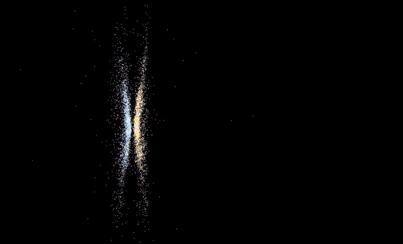
Figure 6–9: A time sequence for the “Generic model B” minor merger in the yz plane evolved with the Barnes-Hut N-body algorithm.
|
|
|
|
|
Start |
1.25 billion years |
2.5 billion years |
|
|
|
|
|
|
|
|
|
3.75 billion years |
5.0 billion years |
7.5 billion years |
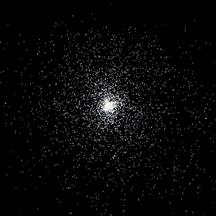
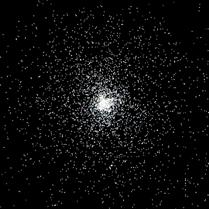
Figure 6–10: A time sequence for the “Generic model B” minor merger in the xy plane evolved with the Barnes-Hut N-body algorithm.
The simulation of the generic model B led to the merger of the disk and the sphere.
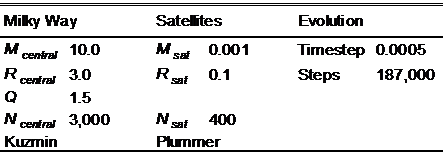
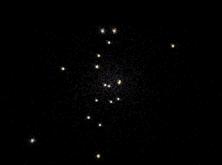
Milky Way galaxy system
Our own Milky Way galaxy is still in the process of galaxy evolution, growing through eating smaller companion galaxies. The Milky Way is currently accreting its small companions, the Magellanic Clouds and numerous nearby dwarf galaxies. The Milky Way’s disk is thickening as a consequence of accretion of smaller companion galaxies (Buser, 2000).
Large and Small Magellanic Clouds
The largest companions of the Milky Way galaxy (MW) are the Large and Small Magellanic Clouds (LMC, SMC). These galaxies orbit the MW every few billion years. Tidal forces of the MW extracted from the Clouds a circumpolar stream of gas known as the Magellanic Stream that trails the LMC and SMC in their orbit around the MW and stretches over 100 degrees in the Southern Sky.
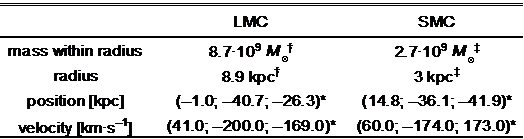
Table 6‑5: Mass, position and velocity of the Large and Small Magellanic Clouds. Parameters (†) from van der Marel et al. (2002), (‡) from Harris and Zaritsky (2006) and (*) from Kroupa and Bastian (1997).
Positions and velocities adopted for the LMC and
SMC are given in Table 6‑5 in Galacto-centric coordinates[60]. We
will model the Clouds as Plummer’s models with masses and radii given in Table
6‑6. Initial conditions of interaction are evolved with the Barnes-Hut N-body
simulation code with the opening angle ![]() .
The timestep is equal to
.
The timestep is equal to ![]() and the overall
simulation covers
and the overall
simulation covers ![]() .
.
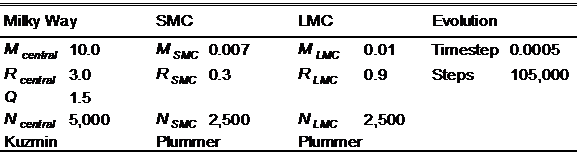
Table 6‑6: Model parameters of the MW, SMC and LMC interaction.
|
|
|
|
|
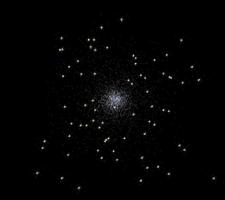
Start |
700 billion years |
1.4 billion years |
|
|
|
|
|
|
|
|
|
2.1 billion years |
2.9 billion years |
3.6 billion years |
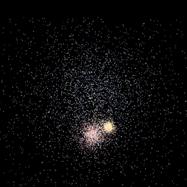
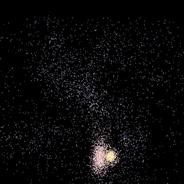
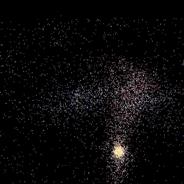
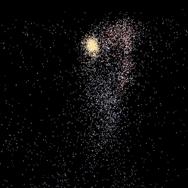
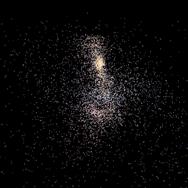
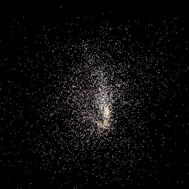
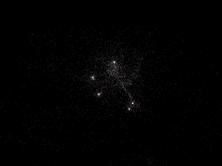
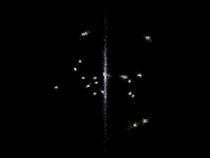
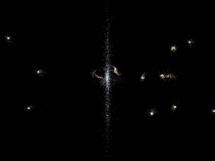
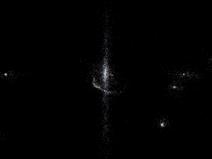
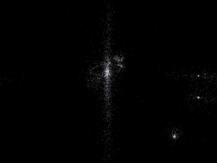
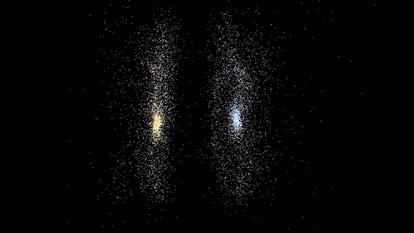
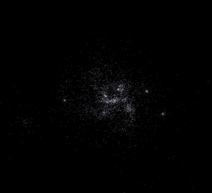
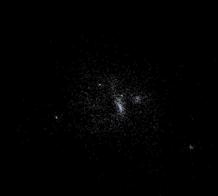
Figure 6–11: A time sequence for the Milky Way and the Small and Large Magellanic clouds merger in the xy plane evolved with the Barnes-Hut N-body algorithm.
|
|
|
|
|
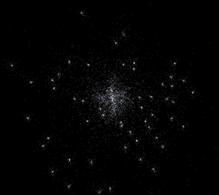
Start |
700 million years |
1.4 billion years |
|
|
|
|
|
|
|
|
|
2.1 billion years |
2.9 billion years |
3.6 billion years |
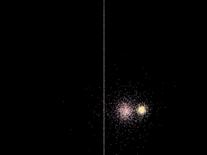
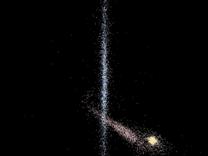
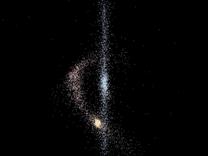
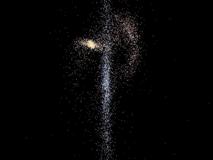
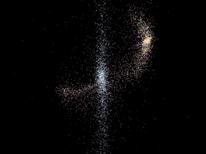
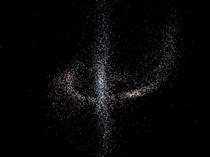
Figure 6–12: A time sequence for the Milky Way and the Small and Large Magellanic clouds merger in the yz plane evolved with the Barnes-Hut N-body algorithm. The formation of a Magellanic Stream-like feature can be seen.
We can see that a lot of stars are being stripped from the Clouds (Magellanic Stream) and is incorporated into the MW’s disk.
Sagittarius Dwarf Elliptical Galaxy
Sagittarius Dwarf Elliptical Galaxy (or SagDEG)[61] was
discovered by Ibata et al. (1994). It is a small galaxy that is penetrating the
disk of the MW. I have chosen to model SagDEG interaction with the MW according
to parameters given in tables 6–7 and 6–8. Initial conditions of interaction were
evolved with the Barnes-Hut N-body simulation code with the opening
angle ![]() . The timestep is equal to
. The timestep is equal to ![]() and the overall simulation
covers
and the overall simulation
covers ![]() .
.
Table 6‑7: Position and velocity of Sagittarius Dwarf Elliptical Galaxy in Galacto-centric coordinates (Read and Moore, 2005).
Table 6‑8: Model parameters of the MW and SagDEG interaction.
|
|
|
|
|
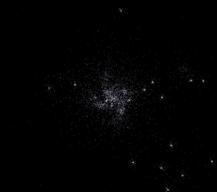
Start |
940 million years |
1.88 billion years |
|
|
|
|
|
|
|
|
|
2.82 billion years |
3.76 billion years |
4.7 billion years |
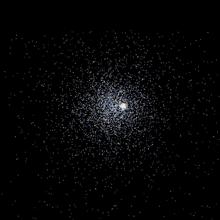
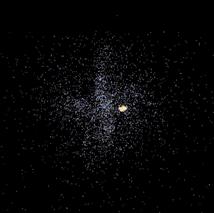
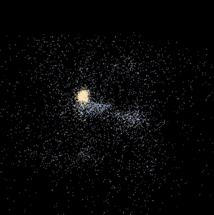
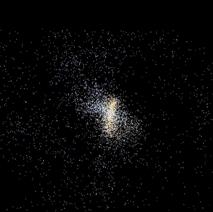
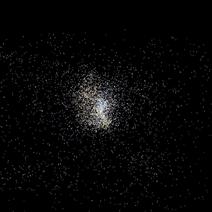
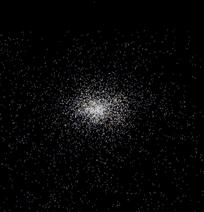
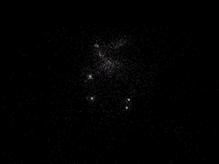
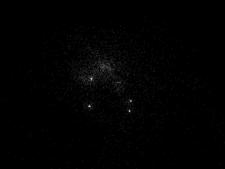
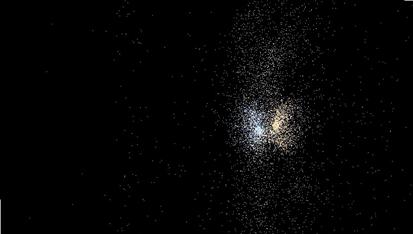
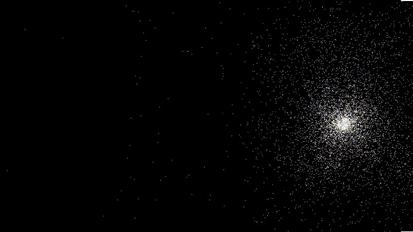
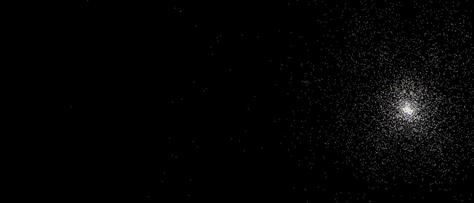
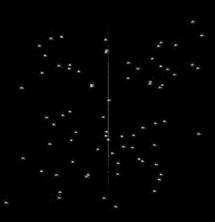
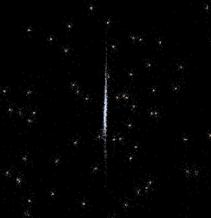
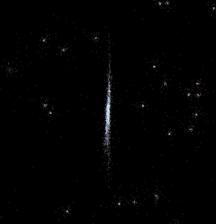
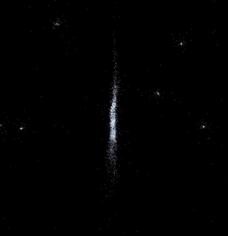
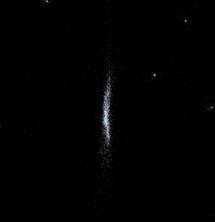
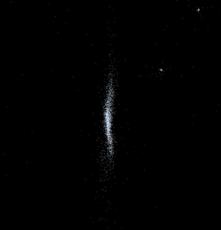
Figure 6–13: A time sequence of the SagDEG evolution in the xy plane evolved with the Barnes-Hut N-body algorithm.
|
|
|
|
|
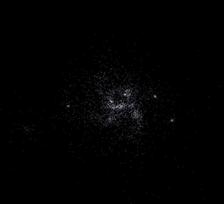
Start |
940 million years |
1.88 billion years |
|
|
|
|
|
|
|
|
|
2.82 billion years |
3.76 billion years |
4.7 billion years |
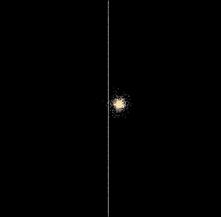
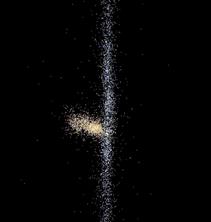
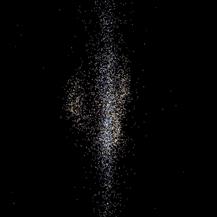
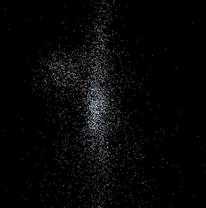
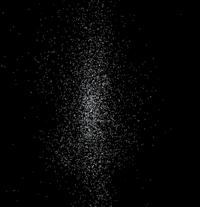
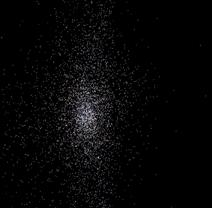
Figure 6–14: A time sequence of the SagDEG evolution in the yz plane evolved with the Barnes-Hut N-body algorithm.
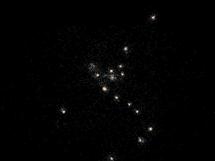
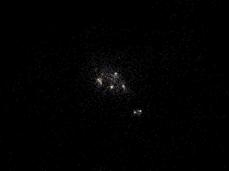
Future of the Milky Way
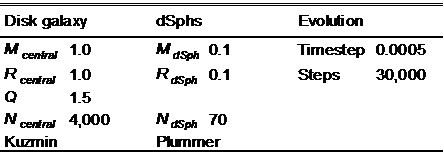
Recent discoveries of new dwarf spheroidal galaxies (dSph) around the MW (Willman et al. 2005, Zucker et al. 2006, Belokurov et al. 2006, Belokurov et al. 2007) with more satellites waiting to be discovered are posing a question about a future evolution of the MW. It is now known that dwarf spheroidals are the most common type of galaxies in the universe.
We will create N-body model of the whole MW system to see its future. Three-dimensional Cartesian positions of satellite galaxies relative to the center of the MW were calculated from given papers (see Table 6–10) as follows:
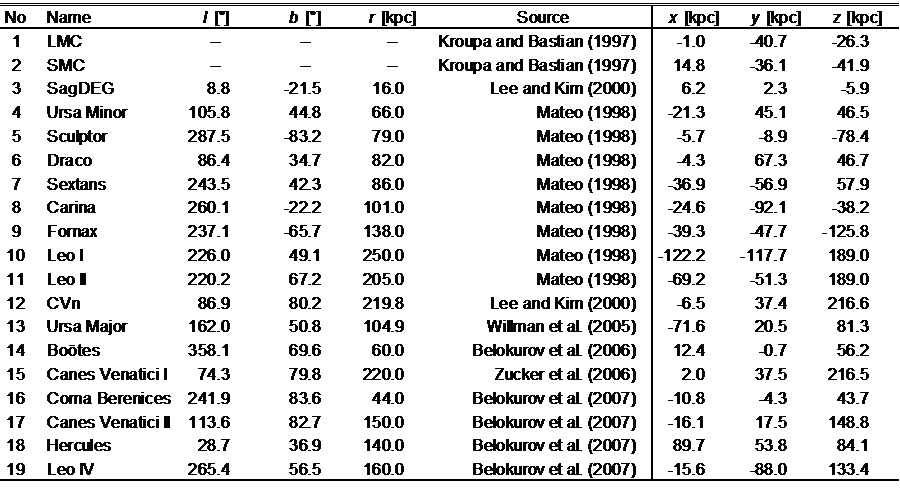 Table 6‑9: